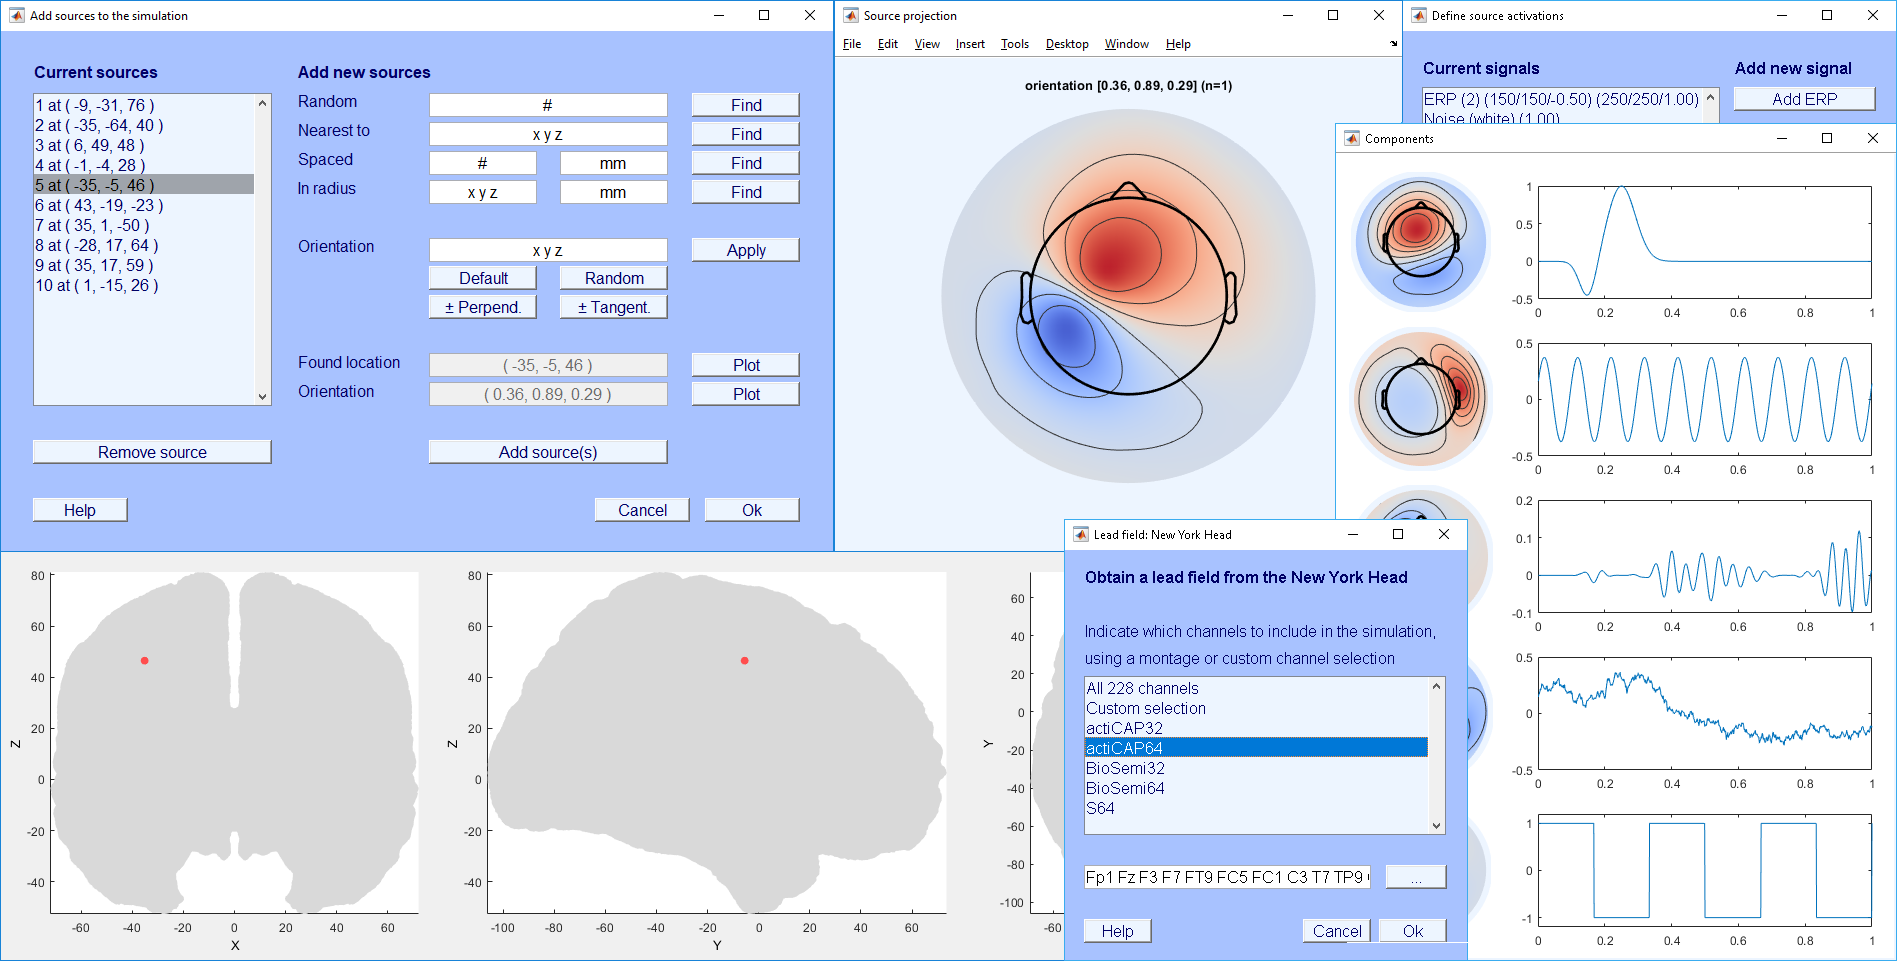
SEREEGA is a modular, general-purpose, free and open-source MATLAB-based toolbox to generate simulated toy data mimicking event-related electroencephalography (EEG) data. It uses EEGLAB for some of its functions.
Starting with a forward model obtained from a head model or pre-generated lead field, dipolar brain components can be defined. Each component has a specified position and orientation in the brain. Different activation signals can be assigned to these components. EEG data is simulated by projecting all activation signals from all components onto the scalp and summing them together.
SEREEGA is modular in that different head models and lead fields are supported, as well as different activation signals. Currently, SEREEGA supports the New York Head (ICBM-NY) pre-generated lead field, the Pediatric Head Atlases pre-generated lead fields, and FieldTrip custom lead field generation. Four types of activation signals are provided: ERP (event-related potential, i.e. systematic deflections in the time domain), ERSP (event-related spectral perturbation, i.e. systematic modulations of oscillatory activations), noise (stochastic processes in the time domain), and signals based on an autoregressive model. A final data class allows the inclusion of any already existing time series as an activation signal.
SEREEGA is intended as a tool to generate data with a known ground truth in order to evaluate neuroscientific and signal processing methods, e.g. blind source separation, source localisation, connectivity measures, brain-computer interface classifier accuracy, derivative EEG measures, et cetera.
As an example, the following code produces an EEGLAB dataset containing 100 epochs of 64-channel EEG data, each consisting of the summed activity of 64 simulated sources spread across the brain. The final dataset includes a ground-truth ICA decomposition that can be used to verify the accuracy of newly calculated decompositions.
% configuring for 100 epochs of 1000 ms at 1000 Hz
config = struct('n', 10, 'srate', 1000, 'length', 1000);
% obtaining a 64-channel lead field from ICBM-NY
leadfield = lf_generate_fromnyhead('montage', 'S64');
% obtaining 64 random source locations, at least 2.5 cm apart
sourcelocs = lf_get_source_spaced(leadfield, 64, 25);
% each source will get the same type of activation: brown coloured noise
signal = struct('type', 'noise', 'color', 'brown', 'amplitude', 1);
% packing source locations and activations together into components
components = utl_create_component(sourcelocs, signal, leadfield);
% simulating data
data = generate_scalpdata(components, leadfield, config);
% converting to EEGLAB dataset format, adding ICA weights
EEG = utl_create_eeglabdataset(data, config, leadfield);
EEG = utl_add_icaweights_toeeglabdataset(EEG, components, leadfield);
Reference:
Krol, L. R., Pawlitzki, J., Lotte, F., Gramann, K., & Zander, T. O. (2018). SEREEGA: Simulating Event-Related EEG Activity. Journal of Neuroscience Methods, 309, 13-24. doi: 10.1016/j.jneumeth.2018.08.001
Links:
SEREEGA on GitHub
SEREEGA manuscript preprint on bioRxiv
SEREEGA manuscript in the Journal of Neuroscience Methods
Noctifer Music is a PHP/HTML5 script to turn any self-hosted audio library into a functional music player running within a browser.
Try the live demo using the password 123.
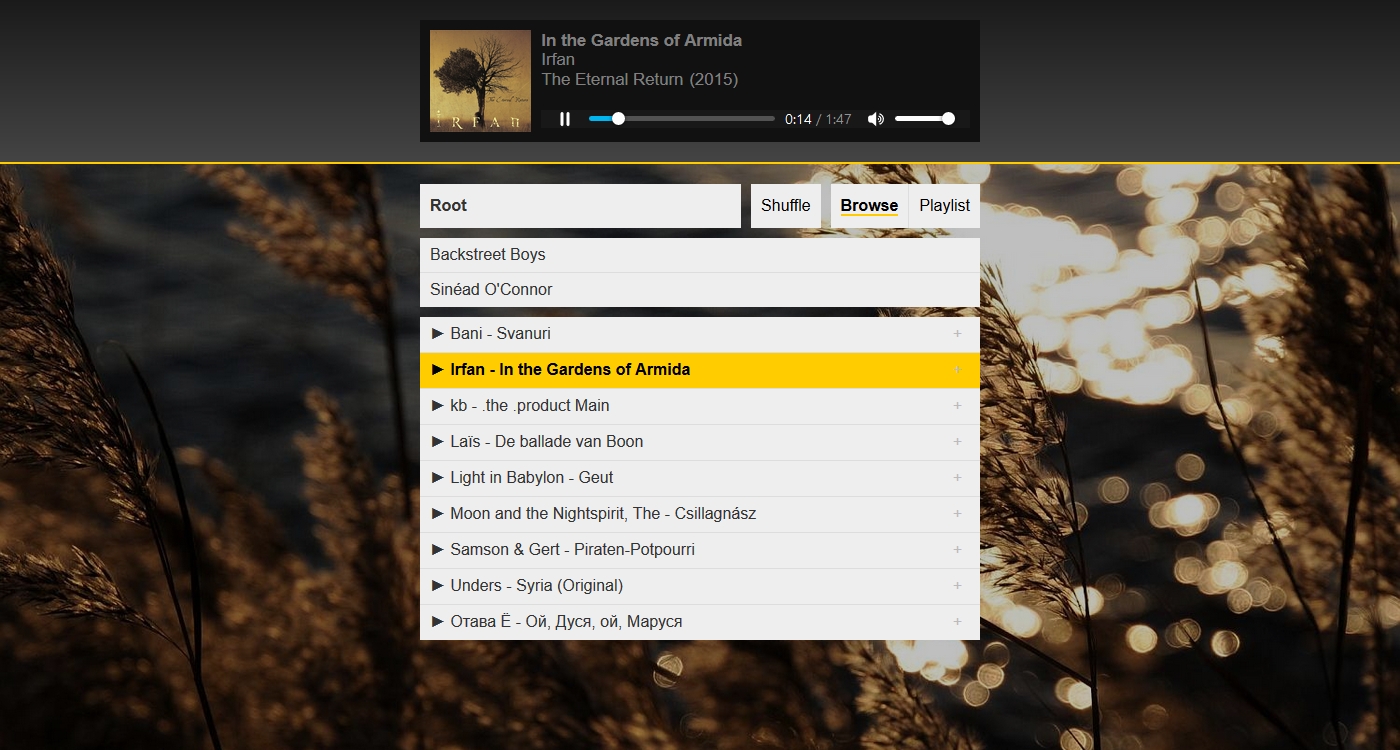
Immediatelly enables folder-based playback: Simply drop index.php into any online directory that has audio files (and/or subdirectories containing audio files), and these files can be streamed immediately. The other files are optional, but recommended.
Supports any format your browser does: Noctifer Music uses the HTML5 audio tag to serve the music. Thus, format support is entirely dependent on your browser.
The live demo (password: 123) has a selection of common file formats available in the Different formats folder, so you can see what works in your browser. (The other folders contain MP3 files, which should work everywhere.)
Metadata: The songs' metadata is read using James Heinrich's getID3. For most file formats, this includes artist, track title, album title, year, and album art.

Custom playlist: Folder-based browsing is the default, but a custom selection of songs can be added to a playlist. The order of songs in the playlist can also be changed on the fly.
Responsive design: The player adapts to smaller viewports and will work on your phone.
Different themes: Custom background images and colour schemes can be used. Three themes are included by default.
Shuffle: Shuffle mode can be toggled and will apply immediately to your current active song list, be it the current song's directory (if you selected a song to start playing from a directory) or your custom playlist (if you selected a song to start playing from the playlist). Shuffle goes through all songs once, before starting over with a newly shuffled list: when shuffle is on, repeat is also on.
Uninterrupted playback while browsing or playlist editing: Browsing and playlist editing is implemented using AJAX calls, leaving the currently playing file unaffected. The page only reloads when a new file is loaded.
Password protection: Direct links to individual files will always play, but access to directory contents can be password-protected.
Keyboard shortcuts and swipes: Noctifer Music uses the original WinAMP keyboard shortcuts, where
z goes to the previous song;
x plays/restarts the song*;
c pauses/resumes the song;
v stops the song*; and
b advances to the next song.
*) These are implemented using fastSeek, which is not available on all browsers yet.
Additionally, left and right button presses also switch to the previous/next track. On mobile, swiping left/right switches to the next/previous track.
Links:
Noctifer Music Live Demo (password: 123)
Noctifer Music on GitHub
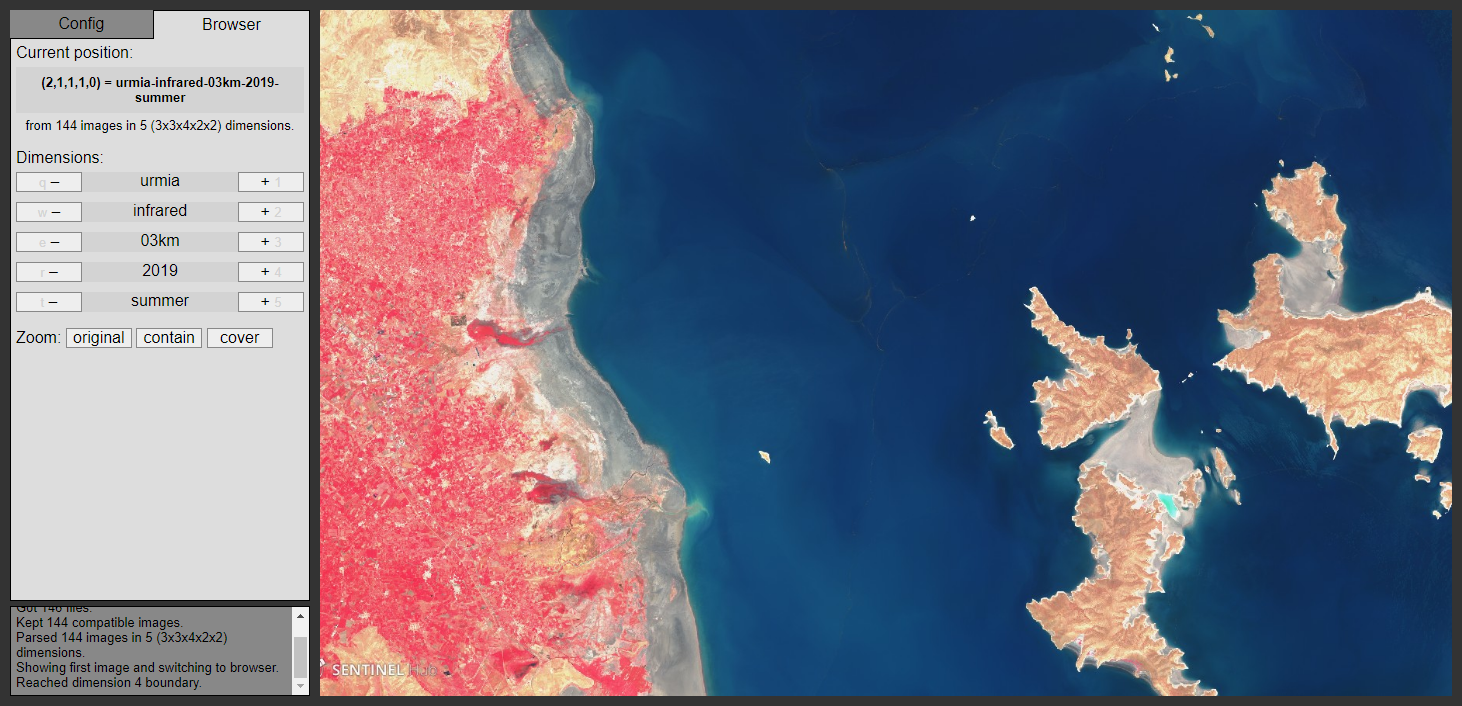
This has made the analysis of some visual data a little easier for me. Rather than browsing through image files in alphabetical order, this browser-based application allows them to be browsed through in a multi-dimensional fashion. Take for example the following files:
apple-brown.jpg banana-brown.jpg
apple-green.jpg banana-green.jpg
apple-yellow.jpg banana-yellow.jpg
pear-brown.jpg plum-brown.jpg
pear-green.jpg plum-green.jpg
pear-yellow.jpg plum-yellow.jpg
Regular alphabetical ordering would have you browse first through all apples, colour by colour, then through the bananas, colour by colour, and then the pears and plums. These files, however, contain two dimensions: fruit type, and fruit colour. This script makes it possible to jump from the green banana to the green apple with one button, and from the green apple to the yellow apple with another.
Loading these images into the MDIB, and indicating the pattern with which to parse the files names, allows the script to automatically extract and order all dimensional values. It will then generate a control panel allowing you to browse through the images either using the GUI or keyboard shortcuts for up to ten dimensions.
File names should be consistent except for the variable parts, and the variable parts should be separated somehow. A variable part of the file names representing one dimension is indicated using an asterisk (*). For the above example, since there are two dimensions separated by a hyphen and the script ignores file extensions, the pattern would be:
*-*
Dimensions are numbered in the order that they appear in the file names. The values of each dimension are ordered alphabetically. All processing is done locally within the browser. No images are uploaded or otherwise transmitted through the Internet.
Link:
Multi-Dimensional Image Browser (online)
Multi-Dimensional Image Browser on GitHub
Older, Python-based Multi-Dimensional Image Browser on GitHub
A permutation test (aka randomisation test) for MATLAB, supporting one- and two-tailed tests and capable of visualising the outcome using a histogram. Provides a p-value, the observed difference, and the effect size. It is also possible to perform exact tests, during which all possible combinations are considered.
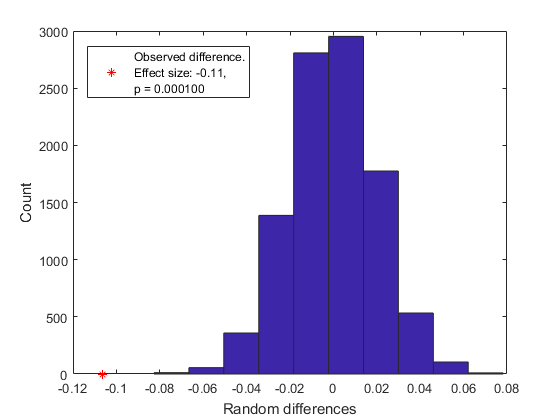
For example, the following tests two samples (n=5000 each) from normal distributions against each other, one shifted .1 to the right (two-tailed, 10000 permutatinos). It produces the subsequent plot.
sample1 = randn(1,5000);
sample2 = randn(1,5000) + .1;
permutationTest(sample1, sample2, 10000, 'plot', 1);
Links:
permutationTest on GitHub
permutationTest on MATLAB Central
This script allows you to generate a colour scale (as for colormap, colorbar) using any number of custom colours, and allows you to arrange these colours by adjusting their relative positions with respect to each other, much like you may be used to creating gradients in e.g. Adobe Photoshop or CorelDRAW. It will automatically interpolate the colours in between the indicated anchor points.

In its most basic form, simply call the script using an n-by-3 matrix of RGB values, and it will generate the colour map accordingly. For example, to create and set a simple black-red-yellow-white colormap, we would put those four colours in that order as the first argument to multigradient, and pass that onto MATLAB's colormap command:
rgb = [0 0 0; 1 0 0; 1 1 0; 1 1 1];
colormap(multigradient(rgb));
It is possible to change the relative location of the colours by adjusting the relative values of the color stops, or control points. One control point must be indicated for each given colour. (Exception: when two colours are given, three control points can be used, with the second one representing the middle of the colour scale.)
pts = [1 5 6 7];
colormap(multigradient(rgb, pts));
Further tricks are optional, but include interpolation in HSV space, isoluminant maps through interpolation in L*a*b* (Lab) space, Kenneth Moreland's algorithm for divergent colour maps for scientific visualisation, and many presets, including some by Kenneth Moreland and Cynthia Brewer.
Links:
multigradient on GitHub
multigradient on MATLAB Central
Kenneth Moreland's website includes good colour advise and the algorithm implemented here.
Cynthia Brewer's color advise for maps from which a number of presets have been taken.
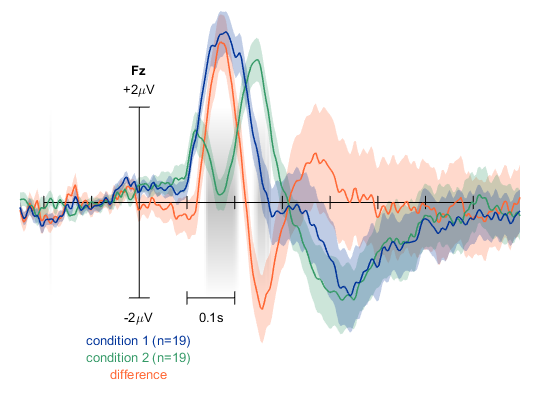
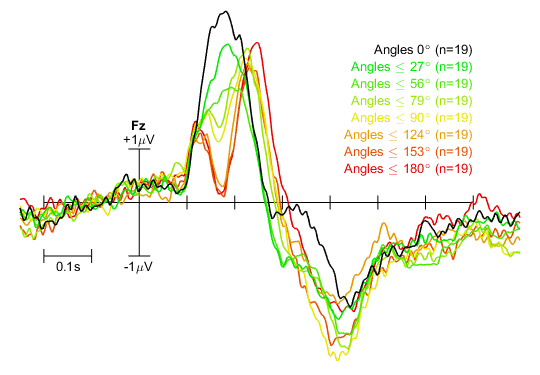
plot_erp is a MATLAB-based script to plot event-related potentials (ERPs) from any number of given epoched datasets (in EEGLAB format), for a single channel. For each ERP curve, any number of datasets can be given. It can optionally calculate and plot a difference wave, standard errors, and permutation-based statistics (using permutationTest). Mean curves and statistics can be calculated either within or between datasets.
For example: Two ERPs plus their difference, standard error of the mean for all curves, and statistics highlighting significant differences, using the default colour scheme.
Or: ERPs for eight groups of 19 datasets each with custom colours, labels, and x scale indicator position.
Link:
plot_erp on GitHub
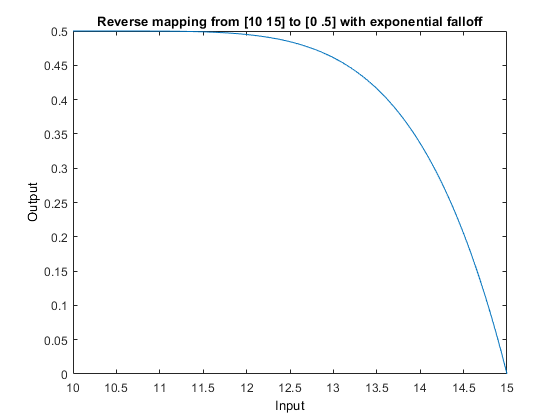
MATLAB script to map values from one range onto another range, either linearly or along a given exponential curve. Also supports inverse ranges, and can extrapolate. This is perhaps a small feat but I've found it to be highly useful in a range of scenarios.
For example, we may map the values in a source range from 10 to 15 to their corresponding values in a target range between 0 and .5, where 10 becomes .5 and 15 becomes 0, with an exponential curve falloff using the power of 5.
Links:
maptorange on GitHub
maptorange on MATLAB Central
This scripts extracts word entries from text files (e.g. plain text dictionaries, word lists, etc.) and then allows case-insensitive regular expression searches to be performed on those entries, for those occassions where you need to find words or terms fitting a specific pattern. German words of exactly 35 characters, for example, or funny words in the English dictionary that twice contain either bb or dd:
Pattern: ^\S{35}$
Hochdruckflüssigkeitschromatografie
Schnittstellenanpassungseinrichtung
Pattern: (([db])\2).*\1
coddymoddy
flibbertigibbet
hoddydoddy

The results of the searches are both shown in the console and written to a text file.
14 dictionaries and word lists are included. Additional dictionaries can be added by simply adding the corresponding names and extraction expressions to the dictionaries array. Encode the files in UTF-8 without BOM.
Empty input either exits the script (when in dictionary selection mode) or goes back to dictionary selection.
Link:
Python Regex Dictionary Search on GitHub
A small, single-file PHP script that handles everything you need in order to turn an online directory into a responsive image gallery. By default, it serves up a thumbnail (and directory) browser, automatically creating thumbnails for supported graphical file formats. When a thumbnail is selected in the browser, or when accessing a specific image directly using its URL, the script serves up a full-screen image viewer with navigational controls. When on desktop, this image viewer can additionally show images either at 100% of their size, or fit them to the screen, and can be controlled by keyboard. On mobile, swipes can be used for navigation. From this screen, the image can also be downloaded.
The script can easily be customised with respect to the thumbnail size, shape, and the number of columns. Furthermore, the style sheet uses only four, customisable colours. Two colour schemes are included.
Links:
This online example uses a dark colour scheme.
This online example uses a light colour scheme.
Noctifer Directory Gallery Script on GitHub

